New Year Special Limited Time 70% Discount Offer - Ends in 0d 00h 00m 00s - Coupon code: cramtick70

QSBA2024 Qlik Sense Business Analyst Certification Exam-2024 Questions and Answers

Questions 4

A company director who spends very little time in applications needs to be informed when a threshold is breached. Which feature should the business analyst use?

Options:

A.

Weekly PDF report

B.

Storytelling

C.

Alerting

D.

Bookmark

Buy Now
Questions 5

The sales manager is investigating the relationship between Sales and Margin to determine if this relationship is linear when choosing the dimension Customer or Product Category.

The sales manager wants to have the potential percentage Sales for each Stage (Initial to Won) of the sales process.

Which visualizations will meet these requirements?

Options:

A.

Scatter plot: Measures X-axis Sales and Y-axis Margin, Dimensions Customer or Product category Bar chart: Dimension Stage, Measure Sales

B.

Scatter plot: Measures X-axis Sales and Y-axis Margin, Alternative dimensions Customer or Product category Funnel chart: Segments Stage, Width Sales

C.

Combo chart: Measures Sales and Margin, Dimensions Customer or Product category Pie chart: Dimension Stage, Measure Sales

D.

Distribution plot: Alternative measures Sales and Margin, Alternatives dimensions Customer or Product category Bar chart: Dimension Stage, Measure Sales

Buy Now
Questions 6

A customer needs to demonstrate the value of sales for each month of the year with a rolling 3-month summary. Which visualization should the business analyst recommend to meet the customer's needs?

Options:

A.

Scatter plot

B.

Mekko chart

C.

Combo chart

D.

Pie chart

Buy Now
Questions 7

A business analyst needs to create a visualization that compares two measures over time using a continuous scale that includes a range. The measures will be Profit and Revenue.

Which visualization should the business analyst use?

Options:

A.

Line chart

B.

Bullet chart

C.

Bar chart

D.

Scatter plot

Buy Now
Questions 8

A business analyst is creating a data model from several Excel files that contain several hundred thousand rows of data. The requirements include:

• Users need to drill down to various details within the available data set.

• Several final measures will be repeatedly used. These final measures require combining several fields in a single table.

• User experience and load time is a high priority.

Which action should the business analyst take to meet these requirements?

Options:

A.

Aggregate the data to the source period

B.

Develop a master item using the required source fields

C.

Combine the various source fields in a calculated item in the Data manager

D.

Combine the source fields and create additional fields in Excel

Buy Now
Questions 9

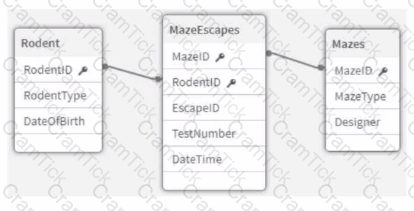
Refer to the exhibit.

An app that will track experiments for rodents (e.g., rats and mice) that navigate mazes (labyrinths) is being developed. Individual rodents are catalogued in the Rodent table, while the Mazes table has metadata for the mazes. The MazeEscapes table holds a record of each attempt at a maze by a rodent. A business analyst needs to build a KPI that will allow users to see how many rodents have made at least one attempt at any maze.

How should the analyst construct the KPI?

Options:

A.

• Create RodentlD AS RodentID_Counter in the MazeEscapes table.

• Use Count (Distinct RodentlD Counter) as the KPI expression.

B.

• Create 1 AS RodentID_Counter in the Rodent table.

• Use Sum (RodentlD Counter) as the KPI expression.

C.

Create 1 AS RodentID_Counter in the MazeEscapes table.

Use Sum (RodentlD Counter) as the KPI expression.

D.

• Create RodentlD AS RodentlD Counter in the Rodent table.

• Use Count (Distinct RodentID Counter) as the KPI expression.

Buy Now
Questions 10

An app needs to load a few hundred rows of data from a .csv text file. The file is the result of a concatenated data dump by multiple divisions across several countries. These divisions use different internal systems and processes, which causes country names to appear differently. For example, the United States of America appears in several places as 'USA', 'U.S.A.', or 'US'.

For the country dimension to work properly in the app, the naming of countries must be standardized in the data model.

Which action should the business analyst complete to address this issue?

Options:

A.

Create a calculated master dimension expression

B.

Load a lookup table to convert values

C.

Cleanse the source text file prior to loading

D.

Use the Replace option in Data manager

Buy Now
Questions 11

The VP of Sales asks a business analyst to include a KPI object on the sales dashboard that shows total sales value for the year 2022, regardless of selections. Existing fields in the data model include Sales and Year.

How should the business analyst write the measure for the KPI object?

Options:

A.

Sum( { < year="|" '2022,="" }="" /> } Sales)

B.

Sum( { $ < year="{" '2022*="" )="" /> } Sales)

C.

Sum( { 1 < year="{" '2022'="" )="M /> ) Sales)

D.

Sum( 1 { < year="(" '2022'="" )="" /> ) Sales)

Buy Now
Questions 12

A business analyst is creating a new app with sales data. The visualizations must meet several requirements:

A Bar chart that shows sales by product group is used in multiple sheets

• A KPI object that visualizes that the total amount of sales is used once

• A Treemap that shows margin by product group is used one time inside a Container

Which visualization should be added to the master items library?

Options:

A.

Container

B.

KPI

C.

Bar chart

D.

Treemap

Buy Now
Questions 13

A business analyst is developing an app that contains a data model with fields: Country, City, Sales, ProductName, and ProductCategory. The global sales manager wants to add new visualizations to this app.

The business analyst must include the following:

• Ability to dynamically change the number of countries and cities

• Display a maximum of 10 countries

• Display a maximum of 5 cities per country

Which steps should the business analyst take?

Options:

A.

• Create two variables: vCountry and vCity

• Add a slider for vCountry and vCity max limit range

• Apply the variable to each visualization

B.

• Add an input field for vCountry and vCity

• Set the dimension limitation to the required maximum values: 5 and 10

• Apply the variable to each visualization

• Add a bookmark Country and City

C.

• Add an input field for vCountry and vCity

• Set the dimension limitation to the required maximum values: 5 and 10

• Apply the variable to each visualization

D.

• Create two variables: vCountry and vCity

• Add a slider for vCountry and vCity

• Apply the variable to each visualization

• Set a sheet action that limits the data displayed

Buy Now
Questions 14

A business analyst is working with retail data for consumer products. The customer is interested in the following:

• Ability to look for outliers on sales volume and margin %

• Ability to understand the clustering of products visually

• Ability to see products that are above the median sales volume

Which action should the business analyst take to implement these requirements?

Options:

A.

Create a pivot table and color the sales volume cell using K-Means function and median sales volume as an additional column

B.

Create a treemap visualization showing sales volume and margin% by product with the median sales volume in the title

C.

Create a combo chart with K-Means colors for the bar and a line measure representing median sales volume

D.

Create a scatter plot using K-Means to color the products and add a median sales volume reference line

Buy Now
Questions 15

A clothing manufacturer has operations throughout Europe and needs to manage access to the data.

There is data for the following countries under the field SACOUNTRY -> France, Spain, United Kingdom and Germany. The application has been designed with Section Access to manage the data displayed.
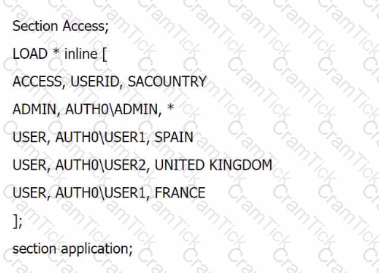
What is the expected outcome of this Section Access table?

Options:

A.

USER1 sees data for France and Spain, USER2 sees data for the UK. ADMIN sees data for France, Spain, Germany and United Kingdom

B.

USER1 does not see data for France and Spain. USER2 does not see data for the United Kingdom. ADMIN sees data for all countries.

C.

USER1 does not see data for France and Spain, USER2 does not see data for United Kingdom. ADMIN can not open the application

D.

USER1 sees data for France and Spain, USER2 sees data for the UK. ADMIN sees data for France, Spain and United Kingdom

Buy Now
Exam Code: QSBA2024
Exam Name: Qlik Sense Business Analyst Certification Exam-2024
Last Update: Dec 27, 2024
Questions: 50
QSBA2024 pdf

QSBA2024 PDF

$25.5  $84.99
QSBA2024 Engine

QSBA2024 Testing Engine

$30  $99.99
QSBA2024 PDF + Engine

QSBA2024 PDF + Testing Engine

$40.5  $134.99