Using the Time Series Table, create a Line chart showing the Monthly Year over Year Growth for the Sales, broken down by Assortment. For the Electronics assortment, which Month had the most NEGATIVE value of Year over Year Growth?
Download the Dataset from: https://drive.google.com/file/d/12AYHfiPWkwBmvH0zbumOURgUX6Az00Rw/view?usp=sharing
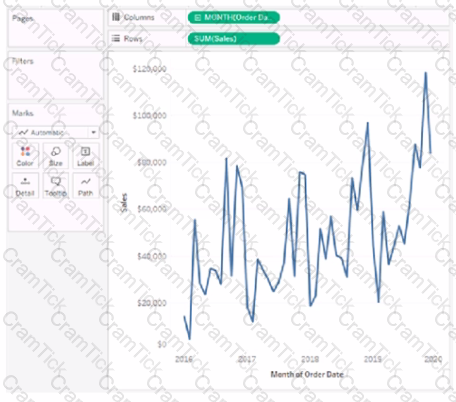
Using the Time Series Table, create a line chart to show Sales over time. Which Month and Year witnessed the lowest Sales?
How can you MANUALLY assign geographic roles to a dimension from the data pane?
What are two benefits of using a live connection to a data source as compared to an extract? Choose two.
You need to display the complete list of potential data connections when you connect to a server. What action should you perform?
Using the dataset, plot a Map showing all the countries, filtered by Market to only include LATAM. Which country in the LATAM Market has the highest shipping delay (sum of total number of days between the order date and the ship date)?
________________ is hosted by Tableau to share our visualisations publically with the world.
You need to invert the color intensity of a quantitative range. Which option should you use?
You have cleaned a data source properly, created some calculated fields and renamed some columns. You want to save these changes for future use cases. Which of the following would BEST satisfy this requirement?
Using the cwurData table, create a cross-tab showing the number of Publications per Country broken down by Institution, and filtered by Country to only show United Kingdown (UK). For the University of Manchester, what percent of the total publications were contributed in 2014?
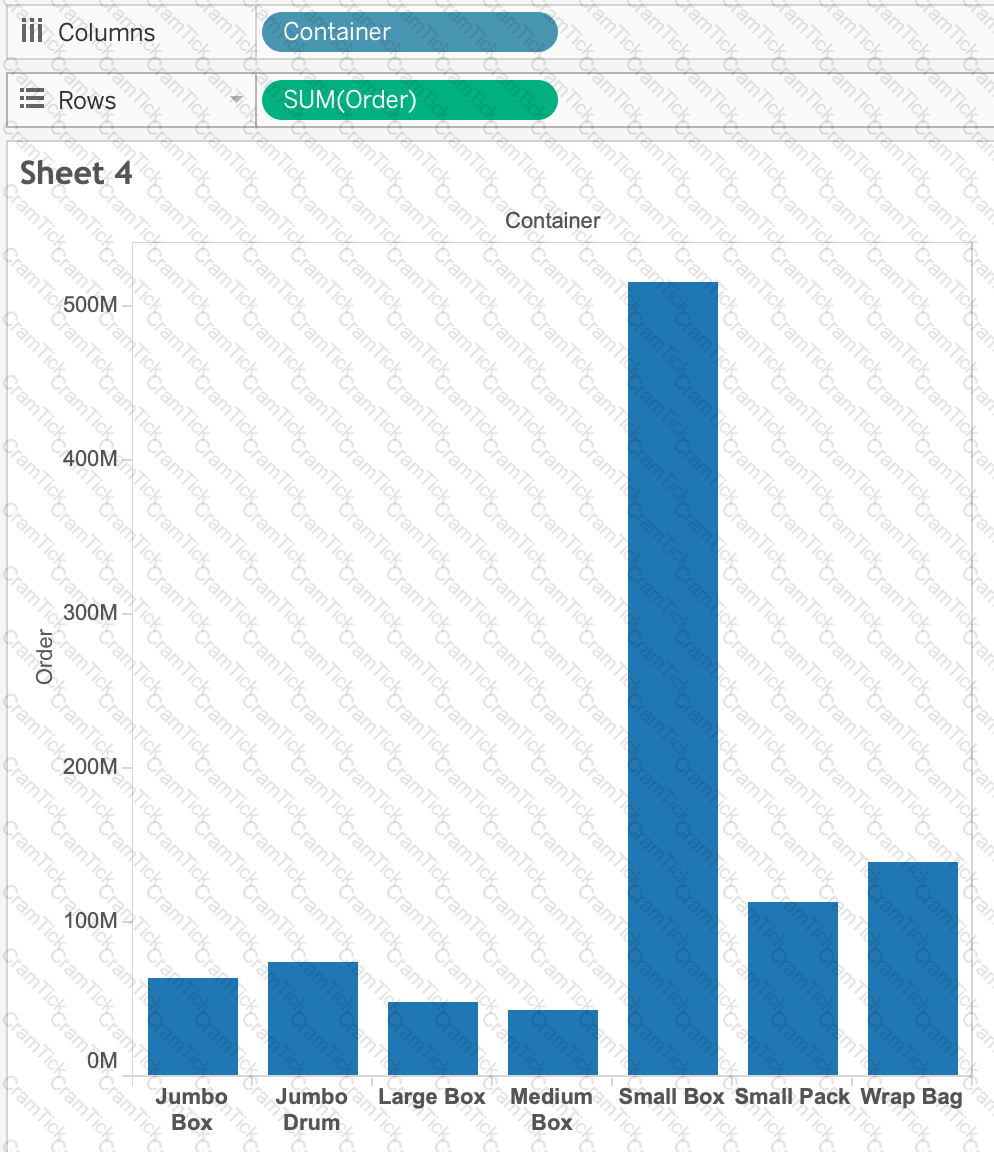
Suppose I have the following view. What will be the total number of marks if I drag a new measure to the row shelf vs the column shelf?

If you decide you want to see all of the marks in the view at the most detailed level of granularity, you can __________________ the view.
A ________________ is a single zip file that contains a workbook along with any supporting local file data and background images. This format is the best way to package your work for sharing with others who don’t have access to the original data.
What is created by a calculated field that has a formula of SUM(Sales)/SUM(Profit)?
Which of the following are valid reasons to use a Tableau Data Extract (.tde) over Live Connections?
Given a map, which of the following fields can be placed on Size,Shape,Detail,Color
When using a data source that has relationships, how can you add a join between two or more tables?
Which of the following lets you group related dashboard items together so you can quickly position them?
When creating an extract, what are three options for specifying how much data to extract? Choose three.
What are two outcomes when you drag a continuous date value to the Rows shelf? Choose two,
When you connect to a new data source, all worksheets that previously referred to the original data source now refer to the new data source. If the new data source does not have the same field names as the original workbook, the fields are marked with an exclamation point

. Which feature helps us fix this issue?
Using the Time-series table, create a cross tab showing the Sales for each Item Number-ID, broken down by Assortments, then add Grand totals to the view. Which Item Number ID made the maximum sales across all assortments?
Is it possible to deploy a URL action on a dashboard object to open a Web Page within a dashboard rather than opening the system’s web browser?
You are creating a combined axis chart.
Where should you drag the second measure after dragging the first measure to the Rows shelf?
Which of the following are valid use-cases for the 'Manage Metadata' functionality?
Which of the following is the correct way to calculate Profit Ratio in Tableau?
Which of the following are valid ways to copy a worksheet visualisation as an image?
Which two elements can have their values changed by using a dashboard action? Choose two.
True or False: You get different filtering options for categorical and quantitative data
Using the atheletes table:
i) Create a sheet with a crosstab showing the Average weight for each sport (Sheet 1)
ii) Create a sheet with a Map showing the Total number of gold medals per Country. Use size as a Mark. (Sheet 2)
Now, Create a Dashboard containing both these sheets, and Use Sheet 2 as a Filter for Sheet 1. What was the average weight for Badminton in Russia?
(Ignore any nulls / unknowns)
Which aggregation is available without requiring a table calculation or calculated field?
Which of the following would you use to connect to multiple tables in a single data source at once?
You have the following visualization.

Where should you place a field named Region to show multiple distinct lines on the same axis?
You need to uniformly change the size for all marks in a view.
What should you do?
Given a map, which of the following fields can be placed in Size,Shape,Detail,Color
In which of the following scenarios would having a live connection be more beneficial than using an extract?
_____________ charts are typically used to represent accumulated totals over time and are the conventional way to display stacked lines.
With the Marks card drop-down menu set to Automatic, a line chart will be created whenever you place what on the Rows shelf and the Columns shelf?
You need to create a calculation that returns a customer name followed by a comma, a space, and then the customer's age (for example: John Doe, 32).
What should you include in the calculation?
Tableau auto-generates ____________ dimension(s) and _____________ measure(s) for us
True or False: A sheet cannot be used within a story directly. Either sheets should be used within a dashboard, or a dashboard should be used within a story.
_____________ contains the visualisations, info needed to build the visualisations, and a copy of the data source.
You have a visualization that uses multiple types of sorting.
How can you clear all sorting of the visualization?
Tableau Desktop Specialist | Desktop-Specialist Questions Answers | Desktop-Specialist Test Prep | Tableau Desktop Specialist Exam Questions PDF | Desktop-Specialist Online Exam | Desktop-Specialist Practice Test | Desktop-Specialist PDF | Desktop-Specialist Test Questions | Desktop-Specialist Study Material | Desktop-Specialist Exam Preparation | Desktop-Specialist Valid Dumps | Desktop-Specialist Real Questions | Tableau Desktop Specialist Desktop-Specialist Exam Questions


