From the desktop, open the NYC
Property Transactions workbook.
You need to record the performance of
the Property Transactions dashboard in
the NYC Property Transactions.twbx
workbook. Ensure that you start the
recording as soon as you open the
workbook. Open the Property
Transactions dashboard, reset the filters
on the dashboard to show all values, and
stop the recording. Save the recording in
C:\CC\Data\.
Create a new worksheet in the
performance recording. In the worksheet,
create a bar chart to show the elapsed
time of each command name by
worksheet, to show how each sheet in
the Property Transactions dashboard
contributes to the overall load time.
From the File menu in Tableau Desktop,
click Save. Save the performance
recording in C:\CC\Data\.
A client wants to flag orders that have sales higher than the regional average.
Which calculated field will produce the required result?
A client requests a published Tableau data source that is connected to SQL Server. The client needs to leverage the multiple tables option to create an
extract. The extract will include partial data from the SQL Server data source.
Which action will reduce the amount of data in the extract?
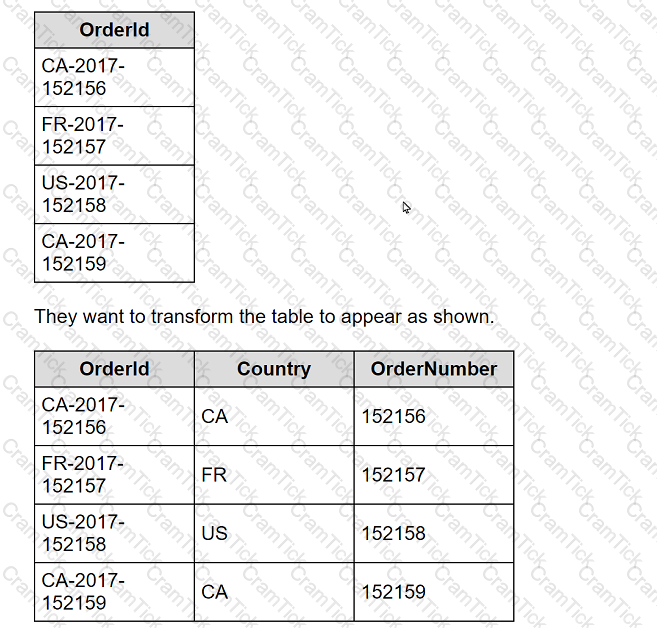
A client is working in Tableau Prep and has a field named Orderld that is compiled by country, year, and an order number as shown in the following table.

What should the consultant use to transform the table in the most efficient manner?
A company has a sales team that is segmented by territory. The team's manager wants to make sure each sales representative can see only data relevant to
that representative's territory in the team Sales Dashboard.
The team is large and has high turnover, and the manager wants the mechanism for restricting data access to be as automated as possible. However, the
team does not have a Tableau Data Management license.
What should the consultant recommend to meet the company's requirements?
A consultant migrated a data source to improve performance. The consultant wants to identify which workbooks need to be updated to point to the new data
source.
Which Tableau tool should the consultant use?
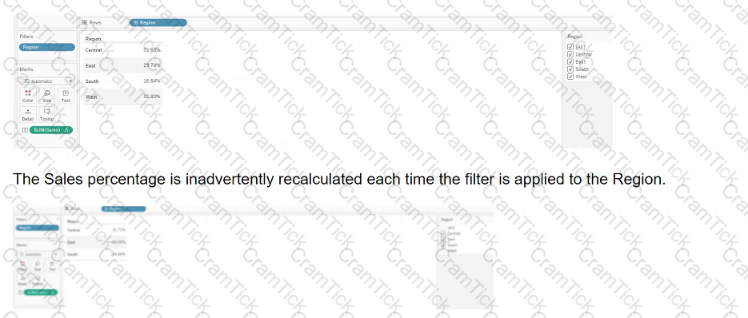
A client calculates the percent of total sales for a particular region compared to all regions.

Which calculation will fix the automatic recalculation on the % of total field?
A company has a data source for sales transactions. The data source has the following characteristics:
. Millions of transactions occur weekly.
. The transactions are added nightly.
. Incorrect transactions are revised every week on Saturday.
· The end users need to see up-to-date data daily.
A consultant needs to publish a data source in Tableau Server to ensure that all the transactions in the data source are available.
What should the consultant do to create and publish the data?
A client builds a dashboard that presents current and long-term stock measures. Currently, the data is at a daily level. The data presents as a bar chart that
presents monthly results over current and previous years. Some measures must present as monthly averages.
What should the consultant recommend to limit the data source for optimal performance?
A client wants to report Saturday and Sunday regardless of the workbook's data source's locale settings.
Which calculation should the consultant recommend?
A consultant builds a report where profit margin is calculated as SUM([Profit]) / SUM([Sales]). Three groups of users are organized on Tableau Server with the
following levels of data access that they can be granted.
. Group 1: Viewers who cannot see any information on profitability
. Group 2: Viewers who can see profit and profit margin
. Group 3: Viewers who can see profit margin but not the value of profit
Which approach should the consultant use to provide the required level of access?
A client creates a report and publishes it to Tableau Server where each department has its own user group set on the server. The client wants to limit visibility of
the report to the sales and marketing groups in the most efficient manner.
Which approach should the consultant recommend?
An online sales company has a table data source that contains Order Date. Products ship on the first day of each month for all orders from the previous month.
The consultant needs to know the average number of days that a customer must wait before a product is shipped.
Which calculation should the consultant use?