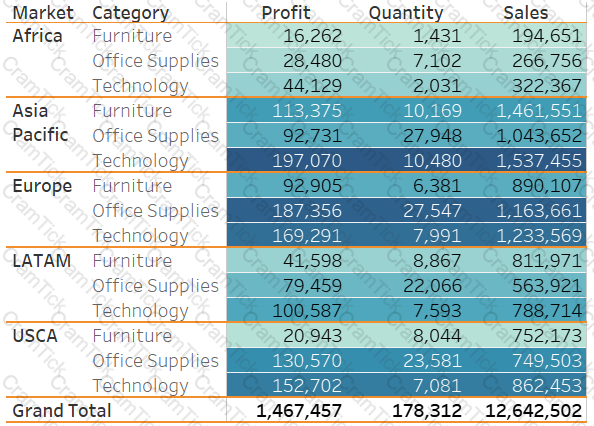
Using the Sales Analysis Dashboard, If you click on any of the products, it should navigate to the All Products worksheet. How you will accomplish it?
Connect to the "Global Superstore" data source and use the Orders table. Find out the percentage of total sales in all categories by customers who have purchased any product which contains the word 'Avery'?
Connect to the "Global Superstore" data source and use the Orders table. Predict the profit of January 2016 using the profit data through December 2015. What is the profit value of January 2016?
Connect to the "Global Superstore" data source and use the Orders table. Create a map that shows the number of unique customers in Australia. Find the state of Queensland. Which neighboring state has the minimum number of unique customers?
Connect to the "Global Superstore" data source and use the Orders table. Find out how many products from the Office Supplies category are in the Top 10 most profitable product list?
Connect to the "Education" data source. Which college(s) average math, verbal, and writing scores are lesser than the overall 70% percentile in these subjects?
Connect to the "Global Superstore" data source and use the Orders table. Create a box-plots to show the sales distribution for each ship mode. Which of the following ship modes have the same median?
Connect to the Olympic Athletes data source, which athlete won at least one gold in 2008 Olympics and then won at least 4 golds in 2012 Olympics.
To create this view, what all you have to do from the following options?
Larger image


